Reports & analysis
The reports hub
Every report, what each one answers, and how to get it out as a PDF or a spreadsheet.
2 min read · Last reviewed 22 Aug 2026
Business Intelligence → Reports is the library. Every report takes a date range and an outlet, and exports to PDF and CSV.
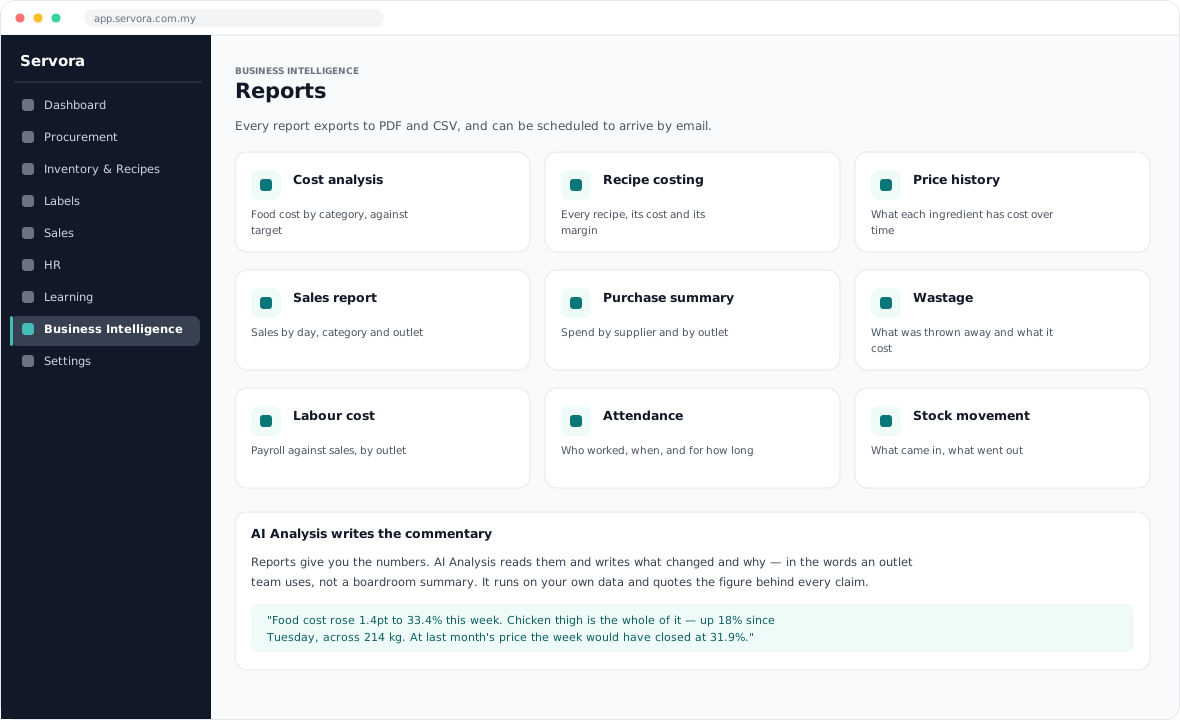
Which report answers which question
| Question | Report |
|---|---|
| Why did food cost move? | Cost analysis, then Price history |
| Which dishes are killing us? | Recipe costing |
| Who are we spending with? | Purchase summary |
| Where is stock disappearing? | Stock movement, then Wastage |
| Is labour in line with trade? | Labour cost |
| What did we actually sell? | Sales report |
| Who worked, and when? | Attendance |
Reading a cost report honestly
Food cost percentage is cost of goods ÷ sales, and cost of goods needs an opening and a closing stock figure. Without a stock take at each end, the report uses purchases as a proxy — which is fine for a trend and wrong for a single month, because a big delivery on the 30th lands entirely in that month's cost.
If a month looks wildly off, check whether it has a stock take at both ends before you go looking for a problem in the kitchen.
Scheduling
Any report can be set to run on a schedule and email itself to a list — the weekly cost report to the operations manager on Monday morning, the month-end pack to the owner. Set it up once under the report's own subscription option.
Big exports
Very large PDFs are generated in the background rather than making you wait on a spinning page. You will see progress and a download when it is ready; leaving the screen does not cancel it.
Still stuck?
Every screen in Servora has the same shape — a filter strip, a table, and the actions on the right. If a guide is missing or out of date, tell your account manager and it gets fixed in the manual, not just in an email.